Author: Alexander Rudat
Info: This article was migrated from the old blog!
Introduction
This article describes how to debug a portlets that is already deployed to WebLogic server using Oracle JDeveloper 11g.
Overview
These a re the basic steps involved in remote debugging an WebCenter portlets deployed in WebLogic:
- Configuration of the WebLogic to support remote debugging
- Configuration of the portlet project in JDeveloper
- Actual debugging of the portlet
Configuration of the WebLogic
To start the WebLogic server in debugging mode, there are a couple of configuration changes that need to be done to the WebLogic domain where the portlet is deployed.
First we need to edit JVM options of the WebLogic server startup script where the portlet is deployed. Normally the startManagedWebLogic.cmd is used to start this managed server.
This startup script is located in the %MIDDLEWARE_HOME%\user_projects\domains\<domain_name>\bin directory, where %MIDDLEWARE_HOME% is the installation directory of WebLogic.
Add the following line before the set JAVA_OPTIONS= line:
set REMOTE_DEBUG_JAVA_OPTIONS=-Xdebug -Xnoagent -Xrunjdwp:transport=dt_socket,address=4000,server=y,suspend=n
Change the set JAVA_OPTIONS= line to read like the one below:
set JAVA_OPTIONS=%SAVE_JAVA_OPTIONS% %ADF_JAVA_OPTIONS% %REMOTE_DEBUG_JAVA_OPTIONS%
After this changes save the startup script and start the managed server and be sure that you have access to the admin console (for example http://localhost:7001/console).
Finally we need to check, that HTTP tunneling is enabled on the managed server. To do this, login to the admin console, select the managed server and select the Protocols tab.
Be sure that Enable Tunneling is selected.
Configuration of the portlet
First let's create a new run configuration specifically for remote debugging. Double-click the project where you portlets are developed.
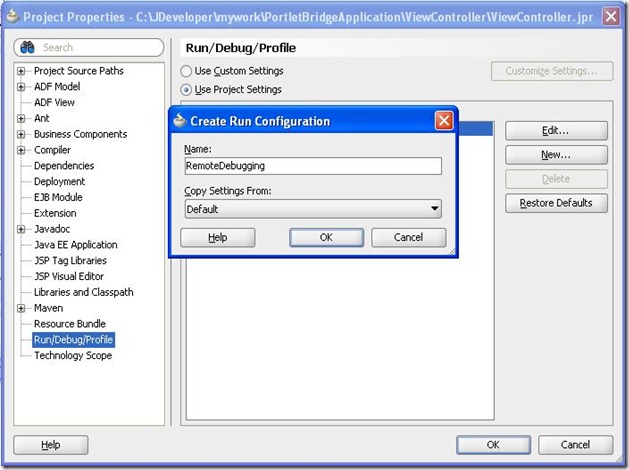
In the Project Properties select the Run/Debug/Profile page. Click New... to create a new run configuration. In the Create Run Configuration dialog enter Remote Debugging for the name of the run configuration. Leave the Copy Settings From selection to Default and click OK to create the new run configuration.
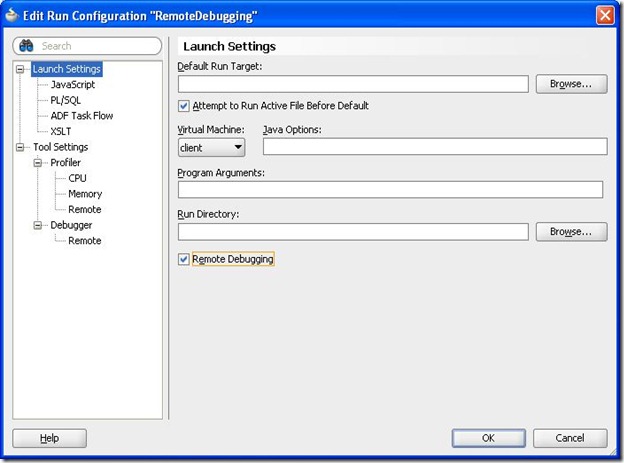
Once the Remote Debug run configuration is created, select it in the Run Configurations and click Edit... to bring up the Edit Run Configuration dialog. In the Launch Settings page click on the Remote Debugging checkbox to enable remote debugging for this run configuration.
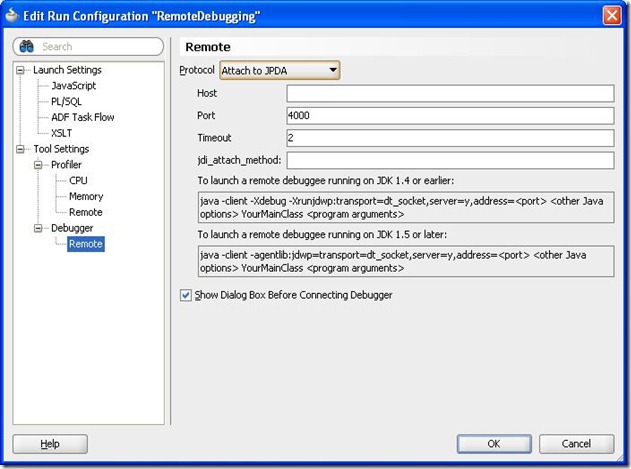
Finally select the Remote page and verify that the Protocol is set to Attach to JPDA and the port matches the port specified earlier when configuring WebLogic for remote debugging (defaults to 4000).
Actual debugging of the portlet
To start the remote debugging profile, right-click on your portlet project and select Start Remote Debugger.
Now JDeveloper is asking the host and port specification. If you WebLogic server is installed locally, you can apply the default settings:
Set a breakpoint at you java code and run the portal (WebCenter) application, where the portlet is used.
References
http://www.oracle.com/technology/products/jdev/howtos/weblogic/remotedebugwls.html


No comments:
Post a Comment